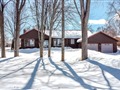
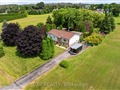
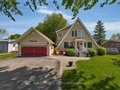
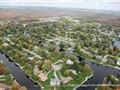
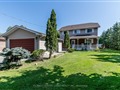
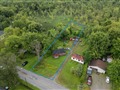
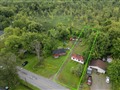
2 Sandlewood Tr
$1,102,026
Comparative Market Analysis
Jun 16, 2025
NOT AN ACTIVE LISTING
Historical Performance
| Period | $ Change | % Change |
| 1 Day | +$378 | +0.034% |
| 7 Days | +$691 | +0.063% |
| 30 Days | -$185 | -0.017% |
| 3 Months | +$1,406 | +0.128% |
| 6 Months | +$26.8k | +2.49% |
| 1 Year | -$29.3k | -2.59% |
| 3 Years | +$267k | +32.0% |
| 5 Years | +$472k | +74.9% |
| 10 Years | +$786k | +249% |
List My Property
Real Estate Statistics
Financing Solutions
Browsing History
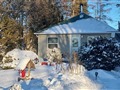
5794 Victoria Park Rd, Ramara
1 second ago
AS SEEN ON


Are You a Licensed Real Estate Agent or Broker?