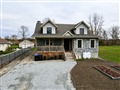
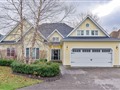
2757 Maple Tr
$320,483
Comparative Market Analysis
Jun 16, 2025
NOT AN ACTIVE LISTING
Historical Performance
| Period | $ Change | % Change |
| 1 Day | +$109 | +0.034% |
| 7 Days | +$92 | +0.029% |
| 30 Days | -$575 | -0.179% |
| 3 Months | -$1,273 | -0.396% |
| 6 Months | +$4,295 | +1.36% |
| 1 Year | -$16.7k | -4.96% |
| 3 Years | +$56.5k | +21.4% |
| 5 Years | +$91.1k | +39.7% |
| 10 Years | +$179k | +126% |
List My Property
Real Estate Statistics
Financing Solutions
Browsing History
16 Korlea Cres, Ramara
1 second ago
AS SEEN ON


Are You a Licensed Real Estate Agent or Broker?